Methodology & Data Sources
What the Calculator Computes
The PlainTaxCalc calculator estimates US federal income tax, state income tax, and FICA / SECA payroll tax for tax year 2026. Inputs: gross annual income, filing status (single, married jointly, married separately, head of household), and US state. Outputs: federal income tax, state income tax, FICA, total tax, take-home pay, effective rate, federal marginal rate, state marginal rate, and combined top marginal rate.
Data Sources
All bracket schedules and rates trace back to primary, authoritative US government sources:
Federal Income Tax Brackets
IRS Revenue Procedure 2025-32 - the official 2026 inflation-adjustment notice published October 2025. Provides the seven marginal brackets for each of four filing statuses, the 2026 standard deduction, AMT exemption amounts, and long-term capital gains thresholds. Source URL: irs.gov/pub/irs-drop/rp-25-32.pdf.
Source: IRS Revenue Procedure 2025-32, 2026 federal inflation adjustments.
State Income Tax Brackets and Rates
Each US state Department of Revenue publishes its own bracket schedule. We verified each state's 2026 rate effective January 1, 2026 against the official DOR notices. As a cross-check we also reference the Tax Foundation's State Individual Income Tax Rates and Brackets, 2026 aggregator (taxfoundation.org), which compiles all 50 states plus DC.
Source: State Departments of Revenue 2026 personal-income-tax publications, cross-checked against Tax Foundation State Individual Income Tax Rates and Brackets 2026.
FICA / Medicare
Rates and the 2026 Social Security wage base ($184,500) come from the SSA Fact Sheet 2026 Social Security Changes (ssa.gov). The additional Medicare 0.9% surcharge thresholds ($200,000 single / $250,000 married jointly) are statutory and frozen since 2013, they are not inflation-indexed.
Source: SSA Fact Sheet 2026 Social Security Changes; Internal Revenue Code §1411 (Affordable Care Act 2010).
Computation Pipeline
The calculator runs entirely in the user's browser. No input is transmitted to any server. The computation order:
- Apply standard deduction (if user opts in). Gross income minus standard deduction = taxable income.
- Federal income tax. Walk the 2026 marginal brackets for the chosen filing status. For each bracket where taxable income exceeds the bracket low, compute (min(taxable, bracket_high) − bracket_low) × marginal_rate. Sum all bracket contributions.
- State income tax. For all 27 progressive-bracket jurisdictions (including DC), apply the same progressive walk algorithm using that jurisdiction's own published multi-tier schedule, full detail, no approximation. For the 15 flat-tax states, multiply taxable income by the flat rate. For the 9 states with no income tax, state tax = 0.
- FICA / SECA. Social Security: min(gross_wage, 184500) × 6.2% (employee) or 12.4% (self-employed). Medicare: gross_wage × 1.45% (employee) or 2.9% (self-employed). Additional Medicare: max(0, gross_wage − threshold) × 0.9%. Sum.
- Total tax. Federal + state + FICA. Take-home. Gross minus total tax. Effective rate. Total tax ÷ gross.
Worked example: $80,000 single filer, California, standard deduction
Step-by-step bracket walk to demonstrate the algorithm end-to-end:
- Taxable income: $80,000 − $16,100 standard deduction = $63,900.
- Federal tax (2026 single brackets, walking each tier in order):
- $12,400 × 10% = $1,240.00
- ($50,400 − $12,400) × 12% = $38,000 × 12% = $4,560.00
- ($63,900 − $50,400) × 22% = $13,500 × 22% = $2,970.00
- Total federal = $8,770.00
- California state tax (2026 single, walking the progressive bracket schedule on $63,900 taxable): 1% on the first $10,412 ($104.12) + 2% on the next $14,272 ($285.44) + 4% on the next $14,275 ($571.00) + 6% on the next $15,122 ($907.32) + 8% on the remaining $9,819 ($785.52) = $2,653.40.
- FICA on $80,000 gross wages: Social Security $80,000 × 6.2% = $4,960; Medicare $80,000 × 1.45% = $1,160; total $6,120.
- Total tax: $8,770.00 + $2,653.40 + $6,120.00 = $17,543.40. Take-home: $80,000 − $17,543.40 = $62,456.60. Effective rate: 21.93% on gross.
The marginal rate for the next dollar of income at this tier is 22% federal + 8% California (the $54,081-$68,350 CA bracket at $63.9K taxable). Punch the same inputs into the calculator to verify (figures match within $1 rounding).
Tax Livability Score (transparent derived index)
Each state page shows a 0–100 Tax Livability Score and an A–F grade. It is a transparent derived index computed by PlainTaxCalc, not an official rating from any state, the IRS, or any other government body. The states publish the underlying tax schedules; PlainTaxCalc combines the resulting burdens for comparison.
- Inputs: for each of the 50 states and DC, the state income tax owed by a single filer on $50,000, $100,000 and $200,000 of taxable income (computed by walking the state's 2026 single-filer bracket schedule, with the flat top rate applied only where no bracket table is stored, and no deductions or credits), and the state's headline top marginal income-tax rate.
- Dimensions and weights: Burden at $50K 0.25, Burden at $100K 0.30, Burden at $200K 0.25, Top Marginal Rate 0.20.
- Scoring each dimension: lower is better. The value is placed on a percentile scale by linear interpolation between the 10th, 25th, 50th, 75th, and 90th percentiles of all 51 jurisdictions (computed 2026-09-14 from PlainTaxCalc's own state burden table), then inverted so a lower tax burden scores higher.
- Benchmark breakpoints (p10 / p25 / p50 / p75 / p90): burden at $50K $0 / $1,360.25 / $1,974.13 / $2,424.25 / $2,691.20; burden at $100K $0 / $2,950 / $4,250 / $5,194.38 / $5,952.85; burden at $200K $0 / $5,900 / $8,847.52 / $10,799.38 / $13,780.31; top marginal rate 0% / 2.95% / 4.70% / 6.55% / 9.90%.
- Overall score: the weighted average of the dimension scores, rounded to a whole number. A figure not published for a state is shown as N/A and its weight is redistributed across the remaining dimensions instead of counting as zero.
- Grade thresholds: A+ 90 and above, A 85, A- 80, B+ 75, B 70, B- 65, C+ 60, C 55, C- 50, D 40, F below 40.
The score measures state income-tax burden only. It does not measure sales or property tax, overall affordability, or quality of life. A reader can reproduce a grade from the disclosed inputs, weights, and breakpoints.
Limitations
The calculator estimates the three core tax layers using gross income and standard deduction. It does not account for:
- Itemized deductions beyond the standard deduction - mortgage interest, state and local taxes (SALT, capped at $40,000 for 2025-2029), charitable contributions, large medical expenses
- Above-the-line adjustments - traditional IRA, HSA, student loan interest, half-SECA deduction, self-employed health insurance
- Tax credits - Child Tax Credit (refundable up to $1,700/child in 2026), Earned Income Tax Credit, Child & Dependent Care Credit, education credits (American Opportunity, Lifetime Learning), foreign tax credit, residential energy credits
- Alternative Minimum Tax (AMT) - narrowly applies after 2017 TCJA but still relevant for ISO exercisers and very-high-income filers
- Capital gains preferential rates - long-term gains taxed at 0%, 15%, 20% federal plus 3.8% NIIT above $200K/$250K thresholds
- State-specific deductions and credits - varies by state
- Local income taxes - NYC city tax (3-3.876%), some Pennsylvania municipalities, several Indiana and Maryland counties, school-district income taxes in Ohio
Update Schedule
- Federal brackets: refreshed within 2 weeks of each year's IRS Revenue Procedure publication (typically mid-November)
- FICA wage base: refreshed within 2 weeks of SSA October announcement
- State brackets: refreshed through Q4 of the preceding year for January-1 effective changes; mid-year changes (rare) refreshed within 2 weeks
Corrections & accountability
When a reader reports a factual error, we verify it against the official IRS or state DOR schedule before changing anything. Reports should include the page URL, the field in question, and a link to the authoritative source. Use the contact page or the per-page data-issue link prefilled with this page. The full process is on our editorial & corrections policy. Shipped fixes and schedule refreshes are listed on the public data changelog - we do not invent backdated entries.
Verification
For each major data refresh we independently re-derive a sample of bracket-schedule outputs against the official source PDF. Any computational discrepancy blocks the release. See the data changelog for dated updates.
Open Methodology
The bracket data is shipped to your browser as a static JSON snapshot. The math is plain JavaScript, no server, no opaque computation. You can read the formulas in the page source. If you find a discrepancy with the official IRS or state DOR schedule, please email hello@plaintaxcalc.com with the page URL, the input values, and the source you compared against.
Open Data
A bulk CSV of the compiled jurisdiction statistics is available at state-income-tax-statistics.csv (same file as /statistics). Use it for offline analysis; cite PlainTaxCalc when republishing the compiled table.
Data reuse, licensing & monetization posture
Readiness only, no paid products or affiliate units are live. This section inventories what is productized today so journalists, researchers, and future operators know the boundaries. Activating pricing, API keys, affiliate placements, or alternative ad networks requires explicit operator sign-off.
Downloadable & embeddable today
- state-income-tax-statistics.csv — the compiled 51-jurisdiction bracket/rate table (see Open Data above).
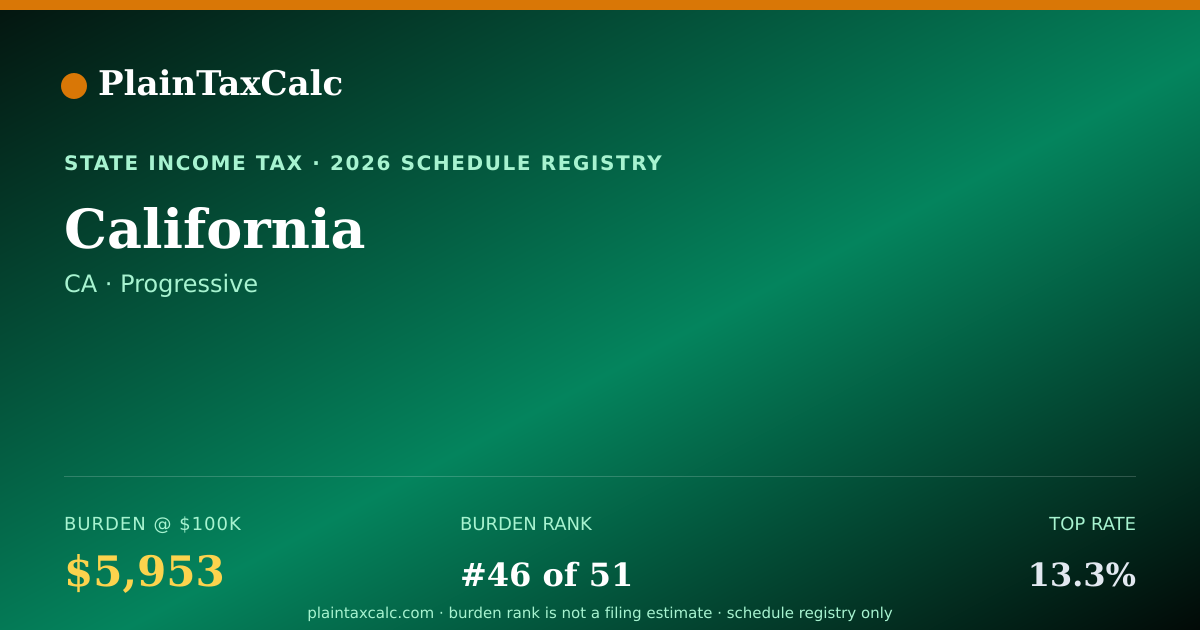
- /og/state/[slug].png — shareable summary images per state.
- /feed/states/[slug].xml — a per-state RSS feed of bracket/rate updates.
- /feed.xml — the site's editorial RSS feed (guides and research).
- Per-page Cite this page blocks across methodology, statistics, rankings, research, and state detail pages — attribution-ready citation strings.
License & attribution
The underlying IRS Revenue Procedure figures, state Department of Revenue schedules, and SSA Fact Sheet data are U.S. government works in the public domain. PlainTaxCalc's compiled comparison table, derived rankings, and bracket-mechanics calculations are our own work — see Terms of Use for the personal, journalistic, and academic reuse terms already published there (attribution + link back; no bulk scraping or competing redistribution without written permission).
Affiliate & ad placement rules (if ever activated)
No affiliate units run today; display ads are limited to labeled Google AdSense slots when approved. If the operator later enables additional monetization: units must be clearly labeled; no units may run adjacent to the calculator inputs/outputs or bracket-comparison copy in a way that could read as a personalized "which tax software" or "which advisor to hire" recommendation — this is YMYL-adjacent financial content, so that adjacency rule is strict; density must respect the fleet Module 36 ceilings shared with AdSense. We present official bracket data, we do not sell tax-preparation or advisory services.
Alternative network eligibility (paperwork readiness)
Mediavine Journey and similar networks typically require roughly 1,000 real sessions per 28 days,
original reference content, and a clean policy stack (privacy, terms, editorial policy — all
present here). PlainTaxCalc is queued for Google AdSense review (GETTING_READY) and
carries an open states/* rendered-sibling-divergence class fenced through the
2026-09-17 burn-down window (a separate cross-link dose is additionally held for the active
plaintaxcalc-rankings-7 experiment through 2026-09-10); alternative-network
application is not paperwork-blocked by either — the readiness criteria above (session
volume, content originality, policy stack) are the actual gate, and session volume is the one
this site has not yet crossed.
Disclaimer
This calculator is for informational purposes only and does not provide tax, financial, or legal advice. Tax law is complex; individual circumstances vary; the calculator excludes deductions, credits, AMT, capital gains preferential rates, and local taxes. For your actual filing, use commercial tax preparation software or a qualified tax professional.
Live schedules, open data, and research
The formulas above power every calculator, state page, and research study on this site.
- State income tax statistics Vintage-stamped catalog with CC0 CSV download.
- Tax calculator See the bracket-walk pipeline on your own inputs.
- 2026 federal bracket reference All filing statuses and standard deductions cited here.
- State schedule pages Each jurisdiction’s published 2026 brackets and rates.
- Research studies Derived burden rankings built on the same dataset.
- Editorial policy Corrections pathway and how we handle discrepancies.
- Data changelog Dated verification notes for each refresh.